

Fresh power wins junior races. Cycling durability decides who keeps winning once they move up. What a national-level junior’s numbers look like after 1,000, 2,000 and 3,000 kJ, how much that changed in a year, and how I build it without rushing it.
The short version
A junior needs enough durability to finish his longest race still within about 10 percent of his fresh 20-minute power. For most juniors that means two to three hours, not four.
Bennett, 17, holds 92 percent of his fresh 20-minute power after 2,000 kJ, and his best race efforts beat that.
His punch fades first. By 2,000 kJ his 20-second power is down to 70 percent.
A year on, he rode the same final climb at GMSR 19 percent harder, with the same work in his legs.
Kilojoules alone do not tell you how tired a rider is. How they were spent matters just as much.
What is durability in cycling?
Durability is what you can still produce after hours of riding, not what you can produce fresh.
Every number you know about yourself as a rider was set fresh. Your FTP test. Your best 5 minutes. Your sprint. You do them rested because that is how you get a clean number you can repeat, and that is exactly how it should be done.
Races do not finish on fresh legs. They finish after two or three hours, a couple of thousand kilojoules, and every surge you followed to get there. What you can still produce at that point is your durability.
Ed Maunder, Stephen Seiler and colleagues gave it a formal definition in 2021. Put simply, it is how long it takes before your numbers start to slip during a long effort, and how far they slip once they do. You will also see it called fatigue resistance, or physiological resilience.
With juniors, the question is not whether cycling durability matters. It is how much of it a 17-year-old actually needs right now. I am going to use one of my juniors, Bennett, to show you what that looks like in real data.
What separates the best juniors is not what separates the best pros
Gabriele Gallo and colleagues went through the power files of 53 climbers across three categories: juniors, under-23s and professionals. In each category they compared the higher-ranked riders with the lower-ranked ones.
Among the juniors, the riders at the front were simply stronger. More power, in absolute terms and per kilogram, and more body mass. Among the under-23s and the pros, the riders at the front stood out for something else: how little power they lost after 20 to 50 kJ/kg of work.
The high-ranked juniors also lost a bigger share of their power after that work than the older riders did.
That is the development curve in one study. Juniors win on what they have fresh. Move up to U23 and beyond, and the riders at the front are the ones who still have it at the end.
How much durability does a junior cyclist need?
The short answer: enough to finish your longest race still within about 10 percent of your fresh 20-minute power. Not four hours. Just your race.
Most junior road races are two to three hours long. A long stage in a junior stage race is capped at around three, occasionally four. That is the window a 17-year-old needs to be durable for right now, not the five and six-hour days that come later if he moves up.
So for a junior, durability means one thing. Still having your best efforts available at the point in the race where it gets decided. If the race splits at two and a half hours, that is the number that matters.
How to check if a junior has enough
Find what your longest race costs. Take the kJ from the file and divide by your weight to get kJ/kg. For Bennett, at 54.4 kg, his races come in at about 1,800 to 2,300 kJ, or 33 to 42 kJ/kg.
Pull your best 5 and 20 minutes after that much work, in WKO5 or from your own files, and compare them with your fresh numbers.
If your 20-minute power is still within about 10 percent of fresh at that point, you have enough for now. That is the benchmark I use with my juniors. Bennett holds 92 percent of his fresh 20-minute power at 2,000 kJ. This, of course, is something we’ll closely monitor and continue to work on as he develops.
Where durability shows up in junior racing
Durability only matters once a race has gone deep enough to test it. A lot of junior racing never gets there.
Not every junior race is a road race. Many are criteriums and circuit races, short and fast, with most of the field still fairly fresh at the end. Those races tend to be decided by a sprint or a late attack, and the rider with the best 20 seconds or the best minute usually wins. That is a different rider from the one who still has 92 percent of his threshold after 2,000 kJ.
Bennett is built the other way. His strength is what he keeps late, not what he has in a sprint against a fresh bunch, and as you will see below, his 20-second power is the first thing to fade. In a short race decided in the last few hundred metres, his durability barely gets a vote.
Put him in a race that goes deep, and it is a different story. Third in a P1/2 race at Tokeneke, against adults. Second overall at the Tour of the Gila, where the two main stages were three hours long and finished uphill. And the Gran Fondo National Title, on a long day.
That is not a weakness to fix by trying to turn him into a sprinter. It is the kind of rider he is, and it is the kind of rider that tends to stand out as the races get longer, which is exactly what Gallo’s data shows. The punch work later in this article is about making sure he still has a kick when a race does come down to one.
How to measure durability: Bennett’s numbers
Bennett is 17 and weighs 54.4 kg (120 lb).
WKO5 models your power-duration curve, and it can build that model using only the riding that came after a set amount of work. So instead of asking what he can do for 20 minutes, you ask what he can do for 20 minutes once he has already done 1,000, 2,000 or 3,000 kJ in that ride.
I used the six weeks from 1 August to 10 September, the block that ran through Tokeneke and the GMSR. Fresh, his model sits at 311W for 20 minutes, 5.7 W/kg. 346W for 5 minutes, 6.4 W/kg. 656W for 20 seconds, 12.1 W/kg. Here is how that changes as the work builds.
| Work done | kJ/kg | 20 seconds | 5 minutes | 20 minutes |
|---|---|---|---|---|
| Fresh | 0 | 656W | 346W | 311W |
| 1,000 kJ | 18 | 515W 79% | 318W 92% | 298W 96% |
| 1,500 kJ | 28 | 473W 72% | 318W 92% | 300W 96% |
| 2,000 kJ | 37 | 458W 70% | 302W 87% | 285W 92% |
| 2,500 kJ | 46 | 414W 63% | 254W 73% | 238W 77% |
| 3,000 kJ | 55 | 430W 66% | 202W 58% | 179W 58% |
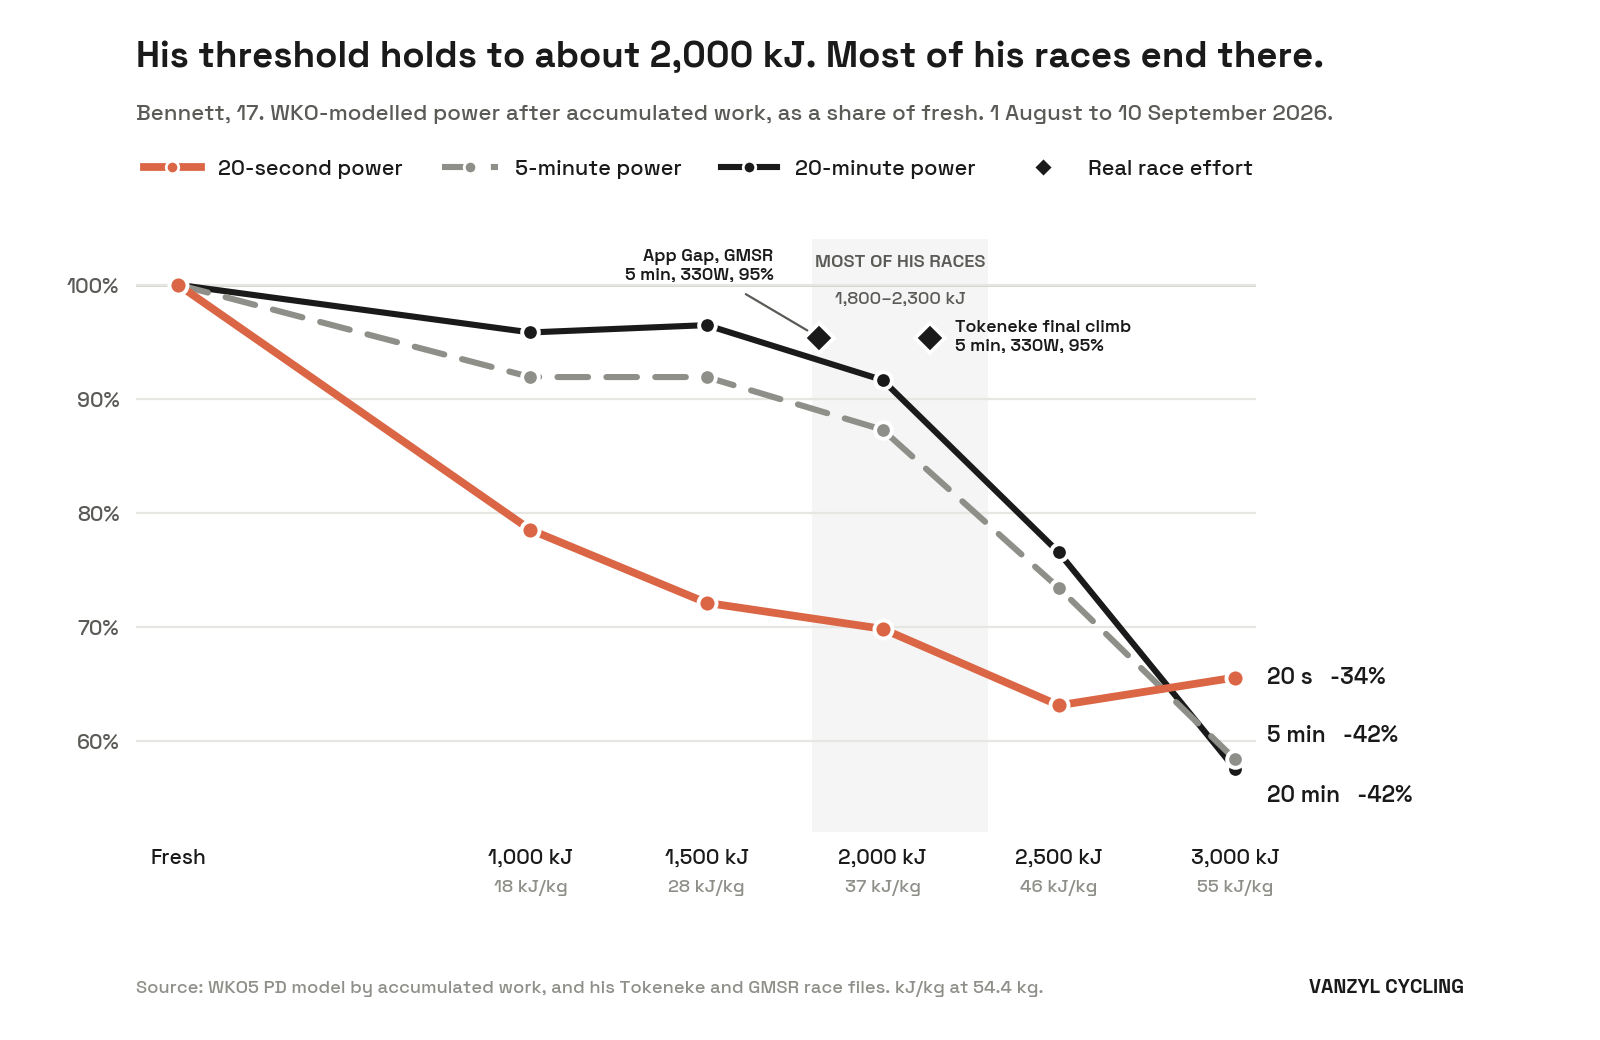
I have shown the work per kilogram as well, because that is how the research reports it and it is the fairer way to compare riders. 2,000 kJ is 37 kJ/kg for Bennett. For an 80 kg rider it is 25 kJ/kg. Same number on the head unit, a very different day and demand.
So what does a race actually cost him? I pulled his biggest races from this year. The two main stages at the Tour of the Gila, where he was second on one, third on the other, and second on GC, were both about three hours and came in at 2,253 and 2,036 kJ. Two stages at the GMSR came in at 1,819 and 2,044 kJ. The Tokeneke Road Race, a P1/2 race where he finished third, was 2,309 kJ in just under three hours. The longest was the Alberg Giro, 3,053 kJ in just under four.
Most of his racing sits between about 1,800 and 2,300 kJ, 33 to 42 kJ/kg. That is the grey band on the chart.
Four things stand out.
1. His threshold holds through the length of his races
After 2,000 kJ, the model still has him at 285W for 20 minutes, 92 percent of fresh, and 302W for 5 minutes, 87 percent. For most of his races, that is the finish line.
His race files from the same six weeks back that up, and beat it. Tokeneke was won and lost on the final climb. He started it with 2,130 kJ in his legs, 39 kJ/kg, and rode 312W for just over eight minutes, bottom to top, on his way to third. His best 5 minutes of the whole race, 330W, came inside that climb. That is 95 percent of his fresh 5-minute power, at the exact point the race was decided.
Two weeks later, stage 3 of the GMSR finished on App Gap. He reached the bottom with 1,782 kJ done and rode it at 305W for 14:19, bottom to finish. His best 5 minutes on it was 330W again.
In training, on easy kilojoules, it looks even better. In April, on a long day in Spain that was mostly Z2 until the climb, he set a new Strava KOM on the long segment up Montseny. More than three hours into the ride, with close to 2,000 kJ already done, he held 308W for 50 minutes of that climb, 5.7 W/kg. More on why that day looks so different in point four.
2. The drop-off starts where his races end
Past 2,000 kJ the line bends. By 2,500 kJ, his 20-minute power is down 47W, from 285 to 238. His 5-minute power is down 48, from 302 to 254. By 3,000 kJ, he is at 179 and 202W.
For most of his races, that is after the finish. The one that went further was the Alberg Giro, 3,053 kJ in just under four hours. 3,000 kJ is 55 kJ/kg for him, beyond the 20 to 50 kJ/kg range Gallo’s study looked at.
The model also has very little to go on that deep. Of the races I pulled, the only one in these six weeks that went past 2,500 kJ was the Alberg Giro, and his best 20 minutes after 3,000 kJ in that window was 154W, so he simply never rode hard that late. His training files suggest the real drop-off comes later, at least after easy riding. On Montseny he averaged 307W over the last five minutes to the top, with nearly 2,900 kJ done.
If that line bent at 1,000 kJ, in the middle of his races, I would be worried. Bending as they end, at 17, it is about where I would expect it to be. That line is what we push out over the next few years. Not this winter.
3. His punch goes first
His 20-second power drops early. By 1,000 kJ it is already down to 515W, 79 percent of fresh. By 2,000 kJ it is 458W, 70 percent, while his threshold at the same point is still at 92.
That matches what Ida Clark and colleagues found in the lab. After long, heavy riding, W′, the work you can do above critical power, starts dropping before critical power does. Short, all-out efforts lean heavily on that reserve. The engine holds. The matches go first.
For a junior, that is the one that matters. Junior races are short enough that the finale often comes down to who can still go hard for 20 seconds to a minute after two and a half hours.
One honest caveat. These curves are WKO’s model of his power after each amount of work, and a model is only as good as the efforts it is built from. At Tokeneke, his real 5 minutes beat what the model gives him after 2,000 kJ by 28W.
For his 20-second power, the model has even less to go on. Several of his biggest races this year were decided on climbs, not in sprints. At Gila stage 4, which finished uphill, his best minute of the whole race, 406W, came in the final minute with 2,000 kJ already done. The engine was clearly still there. But he rarely had to throw a true 20-second sprint that late, so part of that drop could be missing data rather than missing legs. The only way to find out is to test it.
4. Not every kilojoule costs the same
Montseny and Tokeneke look similar on paper. Both efforts came after roughly 2,000 kJ. The riding before them was nothing alike.
Before that 50-minute effort on Montseny, 91 percent of his work had been under 250W, and he had spent about a minute above 330. Before the final climb at Tokeneke, he had spent 18 minutes above 330W, 406 kJ of work. At Gila stage 4, it was 17 minutes before the final minute.
That is what racing is. Attacks, covering moves, fighting for position, moving up before the climb. Every one of those burns a match, and the matches you burn early are not there at the end. In training, he can roll into a climb with close to 2,000 kJ of mostly easy riding in his legs and still hold 317W for 20 minutes, 94 percent of his best 20 minutes of the past year. In a race, the same 2,000 kJ costs a lot more, and I would not expect his late-race numbers to match his Montseny numbers.
The research says the same. Jose Luis Sánchez-Jiménez and colleagues pulled together 21 studies in a recent systematic review. After hard prior work, power fell 10 to 20 percent after only 2.5 to 15 kJ/kg. After easy and moderate work below critical power, the drop was usually under 5 percent, even at higher volumes. Bennett’s Montseny day fits that second group: 36 kJ/kg of mostly Z2, and he was still within about 6 percent of his best 20 minutes of the year, in the middle of a 50-minute effort.
So the number on the head unit only tells you half the story. You also need to know how those kilojoules were spent.
What changed in a year
I pulled the same six weeks from last year, 1 August to 15 September 2025, which ran into the same GMSR. Same chart, same model.
Everything below is measured against his fresh power in those same six weeks, so each year is compared with itself.
The cleanest place to see the change is App Gap. He rode stage 3 at GMSR both years, and both years he reached the bottom of the final climb with about the same work done: 1,811 kJ in 2025, 1,782 this year. In 2025 he rode it, bottom to finish, in 15:41 at 257W. This year it took 14:19 at 305W. That is 19 percent more power on the same climb.
Some of that is a bigger engine. In April he took the Strava KOM on Bear Mountain, and his best 10 minutes on the way up was 369W, 6.8 W/kg. But the kJ curves show it is not only the engine. He also keeps more of it.
WKO shows the same shift. After 1,500 kJ, the model had him at 89 percent of his fresh 20-minute power last year. This year it is 96.
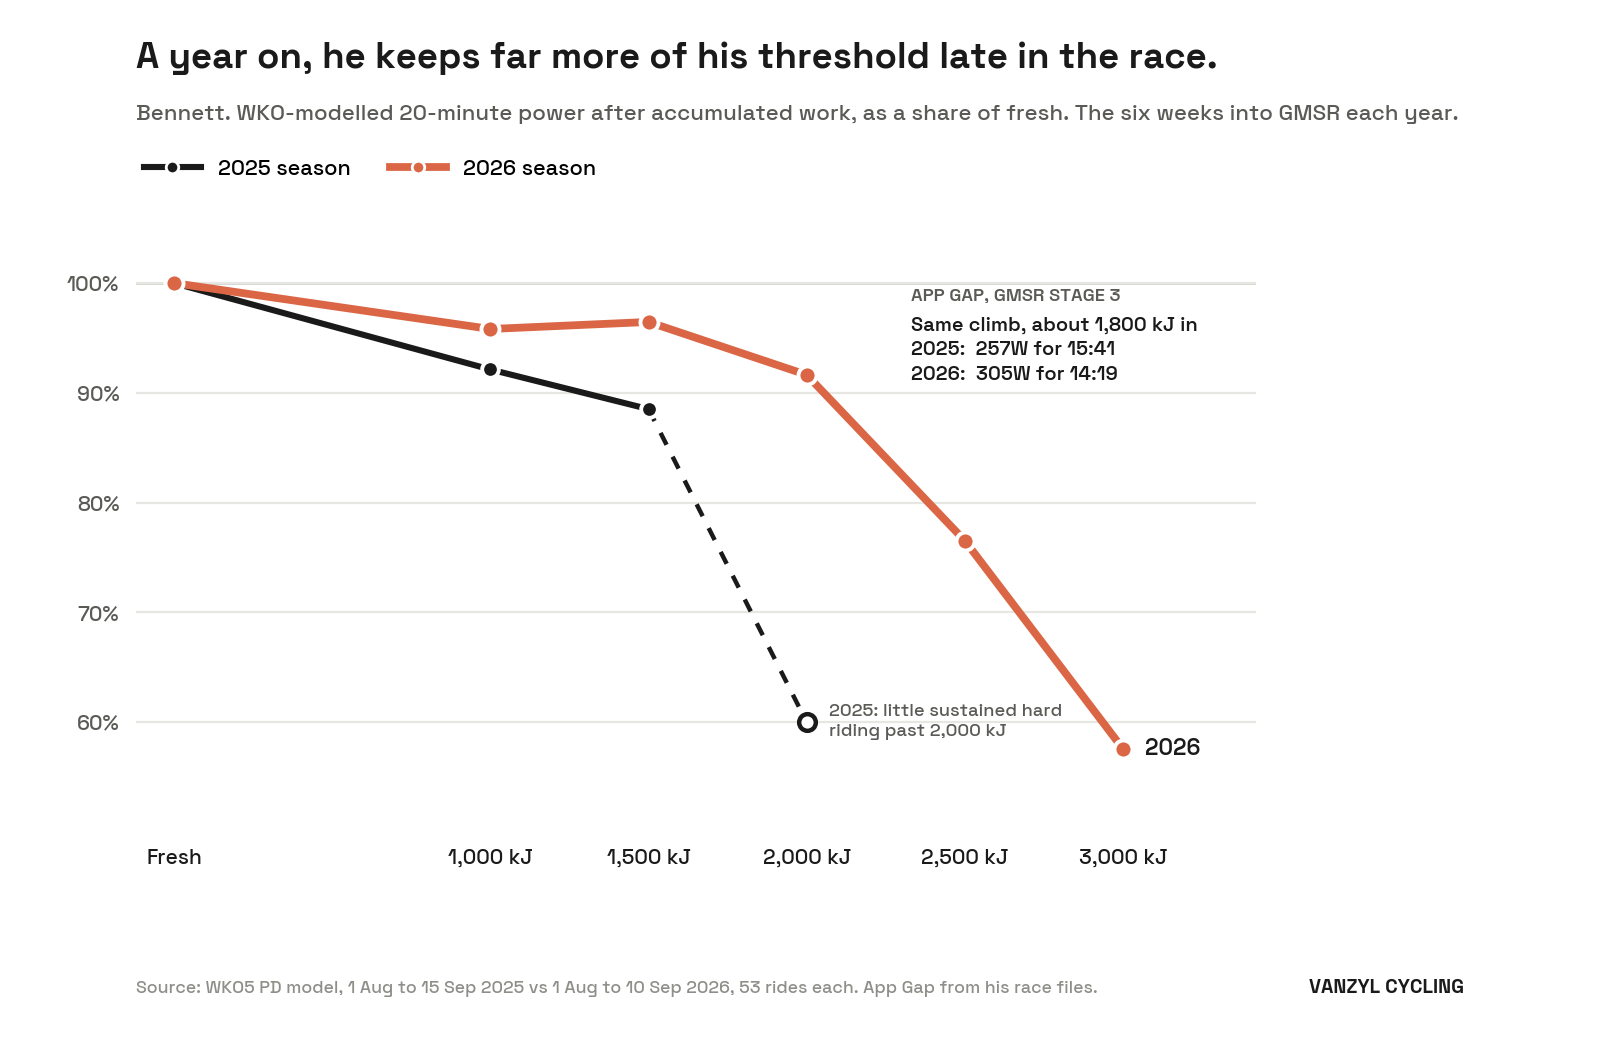
That is the curve moving to the right, one year at a time, which is exactly how Jones and Kirby describe durability being built.
Two honest notes. These kJ curves are only as good as the hard efforts that happen to land after each line. App Gap started at about 1,800 kJ both years, so all but its last two or three minutes sit in the 1,500 kJ curve, not the 2,000. Past 2,000 kJ, last year’s model has him at only 216W for 5 minutes, so there was very little sustained hard riding that late, and the 20-minute line drops to 60 percent, against 92 this year. Some of that gap is real and some of it is simply what each window happened to contain, which is why I lean on App Gap and the 1,500 kJ number.
And his punch did not follow. Last year he kept 92 percent of his 20-second power after 1,500 kJ. This year it is 72. Some of that is how this year’s races played out, decided on climbs rather than sprints. But it is also why the punch is the next thing on the list.
Why I am not chasing four-hour legs at 17
It is tempting to look at that drop past 2,000 kJ and decide the answer is more long rides. I do not think that is right for him yet. He still rides long when it fits, like that day in Spain. What I am not doing is making four-hour legs the goal.
His racing does not ask for it. Training for a demand he does not have takes time away from the one he does.
At junior level, fresh power still decides most races. That is what Gallo’s data shows. Push a 17-year-old towards long, steady volume at the expense of his top end and you can end up with a durable rider who cannot win a junior race.
And durability takes years to build. Andrew Jones and Brett Kirby reviewed what is known in 2025 and pointed to consistent, large training volumes accumulated over years. They were also clear that the data are scant. There is no shortcut, and no reason to look for one at 17.
I would rather he arrives at U23 with room to build into than with pro-sized volume already in his legs. It is the same reason every rider I coach takes a proper off-season. Each year the volume goes up a bit, the curve keeps moving to the right, and the longer days come with it.
How to train durability in a junior cyclist
So the goal for next season is not to move the drop-off. It is to make everything to the left of it as strong as possible, and the punch most of all.
Put the hard work late, at race length
Not five-hour rides. Rides that match his longest races, two and a half to three hours, with the quality at the end once the kilojoules are in. Sprints and 1-minute efforts after 2,000 kJ, not in the first hour when he is fresh.
And the kilojoules before them cannot all be easy ones. Montseny shows what he has after 2,000 kJ of Z2. A race asks for it after 2,000 kJ with 17 or 18 minutes above 330W already done, as at Tokeneke and Gila. So some of those rides get surges and harder blocks early as well. That way the late efforts happen on race-tired legs, not just long-ride legs.
Test the punch on tired legs
A few times a season, a proper all-out 20 seconds and 1 minute late in a long ride. That gives us a real number where the curve currently has a gap.
Fuel it like a race
In Clark’s study, 60 grams of carbohydrate an hour kept critical power intact through two hours of heavy riding. It did not protect W′. So fuelling keeps his threshold there late in the race, but on its own it will not save his punch.
Spend the matches on purpose
Peter Leo and colleagues found that under-23 riders’ power for efforts of a minute and longer was already down after 5 kJ/kg of work above critical power. Pro Team and WorldTour riders showed no real drop until 7.5 kJ/kg. Bennett went into the finales at Tokeneke and Gila stage 4 with 7.5 and 7.8 kJ/kg already done above 330W. That is past the point where Leo’s under-23s started to fade, and right where even the pros did. Every attack he does not need to make in the first hour is one he still has in the finale.
Measure it again next year
We will pull these same six weeks again next year, the way I did for this year and last. If the training is doing its job, the threshold line keeps moving to the right and the 20-second line flattens out.
The point
At 17, durability is not about surviving a five-hour day. It is about still having your best efforts at the moment your race gets decided.
Bennett has that through the length of his races, and a year on he holds it far better than he did. The work now is protecting the punch, not chasing the volume.
The volume comes with the years.
I coach juniors, masters and elite riders, and every plan starts with what the rider’s racing actually asks for. If you are a junior, or the parent of one, and want a plan built that way, get in touch.

Bennett won the 2026 Gran Fondo National Championships in Maryland. Both Overall, and his u17/18 category.
References
Clark IE, Vanhatalo A, Thompson C, Joseph C, Black MI, Blackwell JR, Wylie LJ, Tan R, Bailey SJ, Wilkins BW, Kirby BS, Jones AM. Dynamics of the power-duration relationship during prolonged endurance exercise and influence of carbohydrate ingestion. Journal of Applied Physiology, 127(3), 726-736, 2019. https://doi.org/10.1152/japplphysiol.00207.2019
Gallo G, Mateo-March M, Leo P, Campos-Donaire A, Gandia-Soriano A, Giorgi A, Faelli E, Ruggeri P, Codella R, Mujika I, Filipas L. Power road-derived physical performance parameters in junior, under-23, and professional road cycling climbers. International Journal of Sports Physiology and Performance, 17(7), 1094-1102, 2022. https://doi.org/10.1123/ijspp.2021-0554
Jones AM, Kirby BS. Physiological resilience: what is it and how might it be trained? Scandinavian Journal of Medicine and Science in Sports, 35(3), e70032, 2025. https://doi.org/10.1111/sms.70032
Leo P, Mateo-March M, Giorgi A, Muriel X, Javaloyes A, Barranco-Gil D, Pallarés JG, Lucia A, Mujika I, Valenzuela PL. The influence of high-intensity work on the record power profile of under-23, pro team, and World Tour cyclists. International Journal of Sports Physiology and Performance, 19(6), 545-549, 2024. https://doi.org/10.1123/ijspp.2023-0451
Maunder E, Seiler S, Mildenhall MJ, Kilding AE, Plews DJ. The importance of ‘durability’ in the physiological profiling of endurance athletes. Sports Medicine, 51(8), 1619-1628, 2021. https://doi.org/10.1007/s40279-021-01459-0
Sánchez-Jiménez JL, Salas-Montoro JA, Mateo-March M, Priego-Quesada JI, Zabala M, et al. Is intensity the most important factor in determining the amount of prior work accumulated that affects cyclists’ acute durability? A systematic review. European Journal of Applied Physiology, 126(1), 163-179, 2026. https://doi.org/10.1007/s00421-025-05885-0
Johann van Zyl is a USA Cycling-certified coach based in Boulder, Colorado, and the founder of VANZYL CYCLING. He coaches juniors, masters, and elite riders. Before coaching, he raced six seasons as a professional with MTN-Qhubeka and Dimension Data, including four Grand Tours and five Monuments.