

Critical Power vs FTP: What’s the Difference, and Why It Matters
Two ways of describing the same rider, built from different tests and different math. One gives you a single number. The other gives you a model you can predict with. Here's how they differ, how I use both, and the part almost everyone gets wrong.
Two riders come to me with the same FTP. 300W each. On paper they're identical. Then I put them in a hard rolling race and one rips everyone's legs off on the punchy climbs while the other gets shelled.
FTP alone couldn't tell me that was going to happen. Critical Power and W’ could have. That's the whole point of this article.
FTP is the number nearly every cyclist knows. Critical Power is the one that actually explains what you can do above threshold and for how long. They're related, they're often close, but they are not the same thing. Understanding the difference changes how you train and how you race. Let me break it down properly, including the two limitations most articles skip.
What FTP Actually Is
FTP, Functional Threshold Power, is an estimate of the highest power you can hold in a quasi-steady state for roughly an hour. It's meant to sit around the point where lactate production and clearance are balanced, the boundary above which the burn builds and doesn't stop.
One caveat on that hour, because it gets repeated as gospel. The hour is the definition, not the reality. Research comparing 20-minute-derived FTP against actual 60-minute efforts has found most riders can hold their calculated FTP for closer to 50 minutes, and other work suggests the 20-minute protocol tends to sit above a rider's true maximal lactate steady state. So treat FTP as a useful anchor, not a promise about what you can hold for 60 minutes.
It's a single number, and that's both its strength and its weakness. One number is easy to test, easy to communicate, easy to build zones from. Sweet spot is a percentage of it, threshold is a percentage of it, your whole week gets anchored to it. Simple.
But one number can only tell you one thing: roughly where your sustainable ceiling sits. It says nothing about what happens above that ceiling, how hard you can go over it, or how long you can stay there before the lights go out. And racing lives above that ceiling.
How FTP gets tested
The common protocols all try to estimate that number without making you ride an hour at max, because a true 60-minute test is brutal and hard to pace:
20-minute test: Ride 20 minutes as hard as you can hold, take 95% of the average. The 5% deduction accounts for the anaerobic contribution over 20 minutes. (Most common)
Ramp test: A steadily rising ramp to exhaustion, with FTP estimated from a percentage of your peak minute. Quick and repeatable, but it tends to read high for anaerobically strong riders whose reserve inflates the result. (I never use this protocol)
8-minute test: Two 8-minute efforts, averaged and discounted. Shorter, but more affected by anaerobic capacity for the same reason.
Modelled FTP, calculated from your entire training history rather than a single test. This is where the line between FTP and Critical Power starts to blur, and I get into it in my WKO5 vs TrainingPeaks piece.
What Critical Power Actually Is
Critical Power comes at the same question from a completely different direction. Instead of estimating one sustainable number, it maps the relationship between power and how long you can hold it, then finds the mathematical boundary underneath the whole curve.
Here's the intuition. You can hold 1000W for a few seconds. 500W for a minute or two. 350W for maybe ten minutes. As duration climbs, sustainable power drops, but it doesn't drop forever. It flattens out and approaches a floor. That floor is Critical Power, the highest power your aerobic system can sustain without dipping into a finite reserve that runs out.
CP is the boundary between what physiologists call the heavy and severe intensity domains. Below CP you can reach a steady state, your body finds equilibrium, and your body can sustain this effort (with enough fuel) for a long time. Above CP there is no steady state. Oxygen consumption drifts toward maximum, lactate accumulates, and exhaustion becomes a matter of when, not if. That boundary is arguably a more precise physiological line than FTP, because it comes from your actual power-duration behaviour rather than a single test and a correction factor.
How Critical Power gets tested
This is the big practical difference. You can't get CP from one effort at one duration. You need maximal efforts across several durations, and that generates a power duration curve.
Multi-effort protocol: Three to five maximal efforts spread across durations, for example 12, 5 and 3 minutes, with long recovery between them or spread across separate days. Each effort is a data point. The model fits a line through them and hands you two numbers at once: CP and the size of the reserve above it. (I use a protocol like this quite often)
3-minute all-out test: A single validated alternative. After a full warm-up you ride absolutely flat out for three minutes. CP is estimated from the average power of the final 30 seconds, and W’ from the work done above that. The catch is that it only works if the effort is genuinely maximal from the gun. Pace it at all and the result is invalid. (Not a protocol I’ve tried before)
Effort selection matters either way. Go too short, under about two minutes, and the effort is so anaerobic it distorts the curve. Go too long, past twenty-odd minutes, and aerobic fatigue and fuelling derails it. The usable window is roughly three to fifteen minutes.
So How Do CP and FTP Actually Compare?
They track each other closely but they are not the same number, and the difference has a direction. In a study of trained cyclists and triathletes, Karsten and colleagues found roughly a 92% probability that CP sits higher than FTP, with a mean difference of about 7 watts. Other work has found gaps of 15 watts or more in well-trained riders.
The correlation between them is very strong, which is why they feel interchangeable. They aren't. The individual spread in those studies ran from about 19 watts below to 33 watts above, which is far too wide to swap one for the other when you're setting training intensities. Two riders can have identical FTPs and meaningfully different CPs.
Practically: expect your CP to come out a little above your FTP. If it comes out well below, that's usually a sign the test data is erroneous or the efforts weren't truly maximal (you had an off day), which brings me to the part of this article that matters most. More on that shortly.
The Number FTP Can’t Give You: W’
Here's where Critical Power earns its keep. A CP test doesn't just give you CP. It gives you W’, pronounced W-prime, and W’ is the number that explains my two identical-FTP riders from the top of this article. The “W’” refers to Work-prime.
W’ is the fixed amount of work you can do above Critical Power before you're done. Think of it as a battery, measured in kilojoules. It has a set size. Every second above CP drains it, and the harder you go above CP, the faster it drains. When it hits zero, you stop (theoretically, and I’ll touch on this too). That's not willpower; the tank is simply empty.
The elegant part: when you drop below CP, the battery recharges. Ride easy enough for long enough, and W’ recharges so you can go again. How fast depends on how far below CP you recover. This is why recovery pace between intervals matters so much, and why two riders with the same CP but different W’ need completely different race tactics or interval prescriptions.
What a normal W’ looks like
Female cyclists typically land around 10 to 14 kJ. Male cyclists usually sit around 15 to 25 kJ. Professional riders can exceed 30 kJ. A big W’ relative to your CP is the signature of a puncheur or a sprinter. A small W’ with a high CP is the diesel, the time trialist, the rider who grinds everyone off the wheel rather than jumping away from them.
In WKO5 you'll see a modelled version as FRC, Functional Reserve Capacity. It's derived a little differently from the classic W’, but the concept is the same: the size of your battery above threshold. When I tell an athlete he sits at 15.7 kJ, and a lighter junior sits nearer 11 kJ, that FRC number is exactly this idea in action.
“CP is how hard you can go more or less forever. W’ is how much extra you’ve got above that, before the tank runs dry. FTP gives you the first idea roughly. Only CP and W’ together give you both.”
CP + W’ Is a Model You Can Predict With
This is the part most riders never get told. Once you know CP and W ’, you don't just have two numbers; you have an equation that predicts how long you can hold any power above CP:
Time to exhaustion = W’ ÷ (Power − CP)
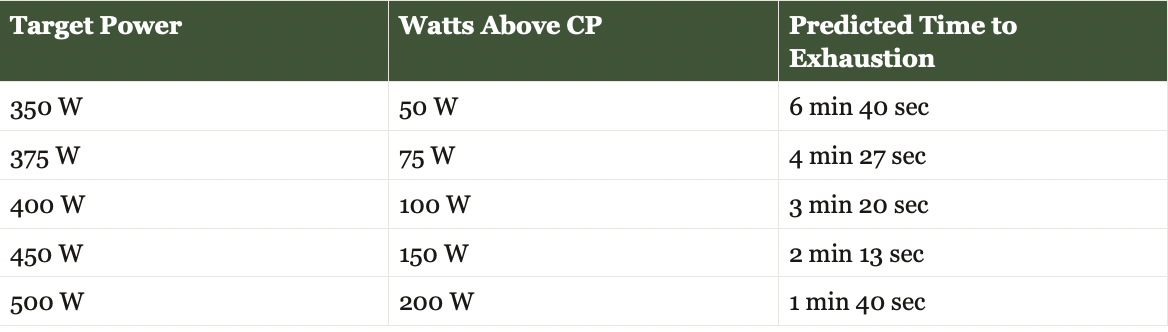
Let me make it concrete. Say a rider tests at CP 300W and W’ 20 kJ, which is 20,000 joules of reserve above CP. Watch what the model predicts in the table above.
Every one of those comes straight out of the equation. 20,000 joules divided by how far above CP you're riding. At 400W you're 100W over CP, so 20,000 divided by 100 is 200 seconds, three minutes twenty. Push to 500W and you're 200W over, the battery drains twice as fast, and you get half the time before you need to recover and recharge.
FTP cannot do this. FTP gives you a zone boundary. CP and W’ give you a predictive model of your engine above that boundary. For a time trialist, a breakaway rider, or anyone whose race is decided by efforts over threshold, that's the difference between guessing and knowing.
Where the Model Breaks Down
Before you go and apply that equation to everything, know its limits. The two-parameter CP model is only valid across a fairly narrow band of durations, roughly three to fifteen minutes.
Below ~ three minutes, the effort is so dominated by anaerobic contribution and neuromuscular factors that the maths stops describing what's happening. Above fifteen to twenty minutes, other things start eating into performance that the model doesn't account for: glycogen depletion, thermoregulation, plain aerobic fatigue. Researchers looking at CP have suggested the model's domain of validity should be capped somewhere under twenty minutes for exactly this reason. There's also evidence that both CP and W’ themselves can decline during prolonged hard efforts, which the simple two-parameter version treats as fixed.
So the model will happily tell you that at one watt above CP you could ride for 5.5 hours. Ignore it. That's the equation extrapolating past where it means anything. Use it inside the three-to-fifteen-minute window, where it's genuinely powerful, and use judgement outside it.
Turning the Model Into Intervals
Now the coaching gold. If the equation predicts how long you last at a given power, you can run it backwards to design the exact interval you want:
Target Power = ( W’ ÷ target time ) + CP
Same rider, CP 300W and W’ 20 kJ. Suppose I want 5-minute efforts that genuinely take him to the limit by the end of each rep. I want exhaustion at 300 seconds. Let’s do the math: 20,000 divided by 300W is 67, add CP, and I get 367. So 367W is the power that empties their tank in exactly five minutes. Prescribe 365-370W, and I know precisely what that interval is doing to them.
Want a savage 3-minute VO2 effort instead? 20,000 divided by 180 is 111, plus CP, so around 411. Want a longer, controlled 8-minute effort that only nibbles at W’ rather than draining it? Ride much closer to CP, and most of the reserve stays in the tank.
This is how you stop guessing at interval targets. Instead of doing four by four at 120% of FTP and hoping that's the right dose, you prescribe efforts that deplete a known amount of the athlete's actual reserve. Two riders with the same CP but different W’ get different numbers for the same session, because their tanks are different sizes.
The recovery side, where most people get it wrong
There's a second half to this. We recharge below CP, so the recovery between reps isn't just rest; it's recharging your W’, and how you ride it changes the whole session. Soft-pedal at half of CP and the battery refills fast. Sit at 90% of CP in your so-called recovery, and it barely refills or doesn’t refill fast enough before you hit the lap button again, which is exactly why athletes who won't back off in the recoveries fall off a cliff halfway through a set.
Recharging isn't perfectly linear, and it's slower than depletion, which is why real interval design still needs a coach's judgement rather than blind faith in a formula. But the principle is solid: control the recovery intensity, and you control how much W’ is available for the next rep. That's a lever most riders don't know they're holding.
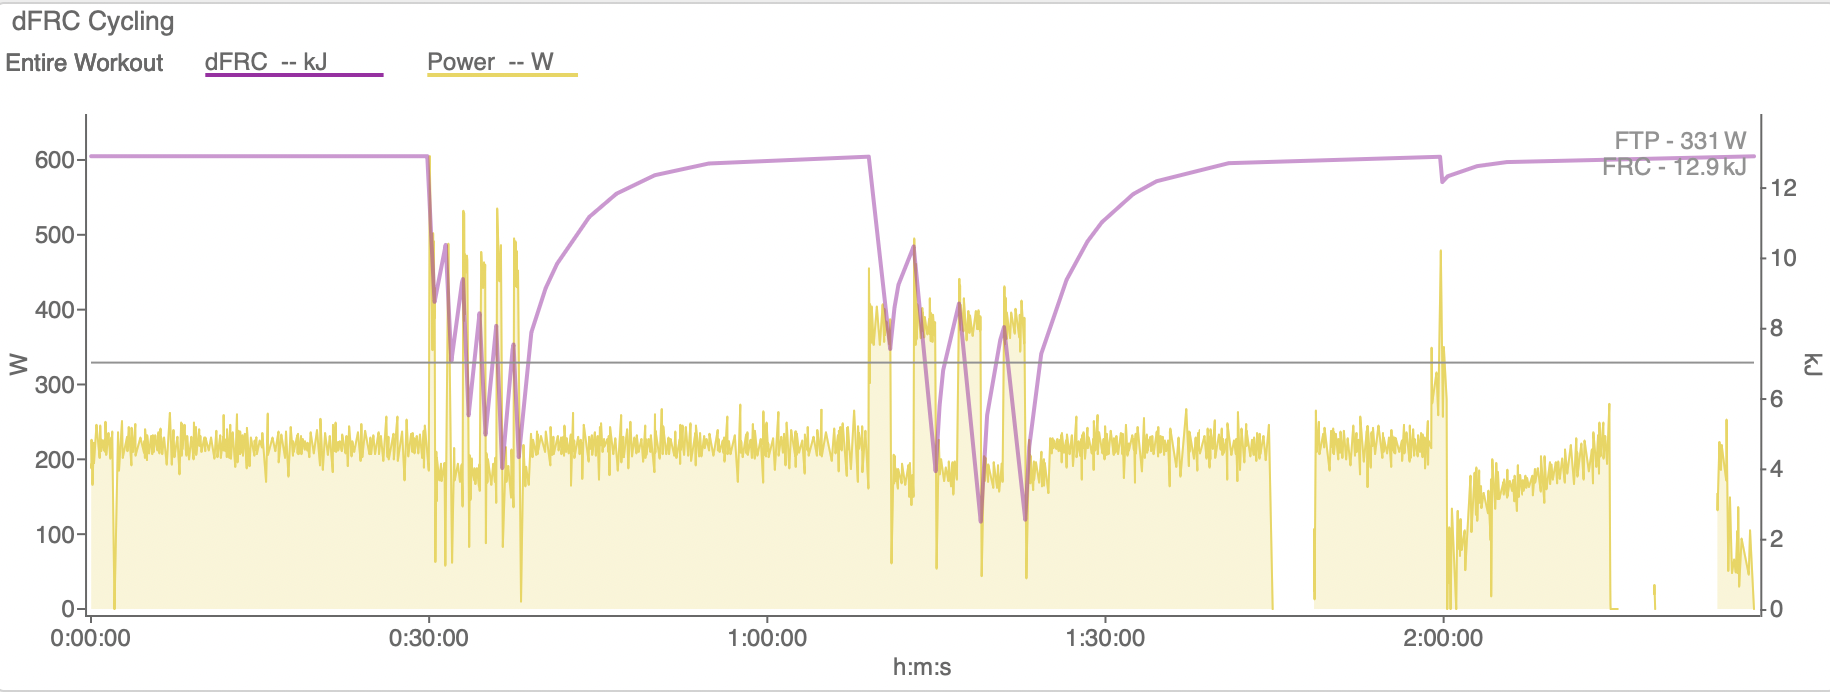
Example of one of my depletion workouts. The goal was not to 100% empty the tank, but to get comfortable repeating high intensity efforts under a semi-depleted W’ state.
The Model Is Only as Good as What You Feed It
Here's the part that gets skipped, and it's the difference between a model that sharpens your training and a number that quietly lies to you. I cannot emphasize this highly enough!
CP, W’, mFTP, FRC, every one of them is fitted to your actual maximal efforts. The maths cannot invent data. If you have never gone truly deep for 30 seconds, the model has no idea how big your battery is. If you haven't done a hard 10 to 20 minute effort in three months, your threshold estimate is built on stale data. The software will still hand you a confident-looking number to three significant figures. That number is a guess dressed up as precision.
How that actually works
WKO5 builds your power-duration curve from your mean maximal power data, and the headline metrics run on a rolling 90-day window by default. That rolling window is the thing to understand. When one of your peak efforts drops out the back of the 90 days, your next-best effort at that duration becomes the new best, and the curve sags at that point, even if you haven't lost a watt of fitness. Your numbers go down because your data got older, not because you got slower.
Gaps distort it too, not just age. TrainingPeaks' own documentation is blunt about this: if the model isn't populated with efforts across short, medium and long durations, the derived metrics won't be accurate. They even give the tell to watch for: if your W’ or FRC balance drops below zero during a workout, the model is underestimating your reserve, and you need to go feed it some short maximal efforts. Their guidance is to do exactly that, then run a proper testing protocol.
What feeds what
Miss a region and the curve has to interpolate through the gap, and everything sitting on top of that fit inherits the error. An athlete with no short maximal efforts will have an unreliable FRC. An athlete who never rides longer than fifteen minutes hard will have a soft threshold number.
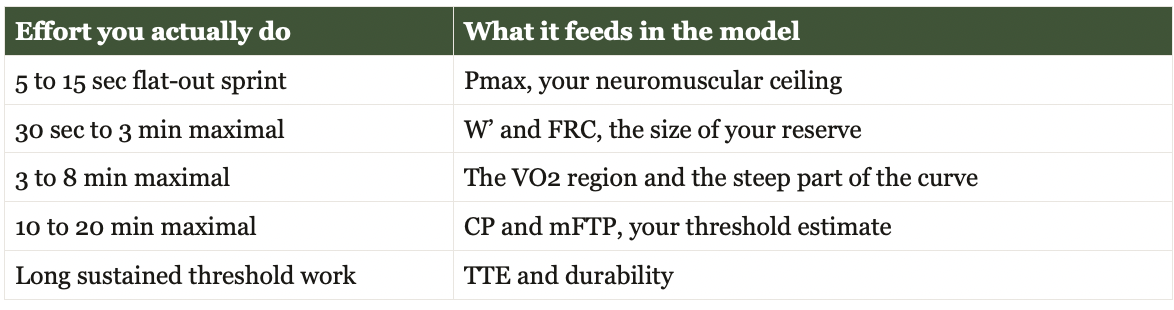
If you want a model you can actually prescribe from, it needs data across the whole curve. Roughly:
One quirk worth knowing before you panic
The metrics interact. Go and do a block of short maximal efforts, lift your FRC, and you may well see your mFTP tick down at the same time. That isn't your threshold collapsing. mFTP is an aerobic measure, and FRC is anaerobic, and in the model they trade off against each other as the curve reshapes. When your numbers jump around after a testing block, it usually means you gave the model better information, not that your fitness changed overnight.
What this means practically
Racing feeds the model beautifully. A race naturally produces maximal efforts across every duration: the sprint out of a corner, the two-minute bridge, the twenty-minute climb. Athletes who race regularly tend to have well-fed models almost by accident. Athletes on a steady diet of endurance and tempo, or riders doing a long winter block indoors, end up with a model slowly starving, numbers drifting down, and no idea why.
If I'm going to prescribe your intervals off your power-duration curve, that curve has to be built on recent, genuine data. You have to feed the data, and as a coach, know when something feels off.
So Which One Should You Use?
Both. They answer different questions, and the best picture comes from using them together rather than picking a side.
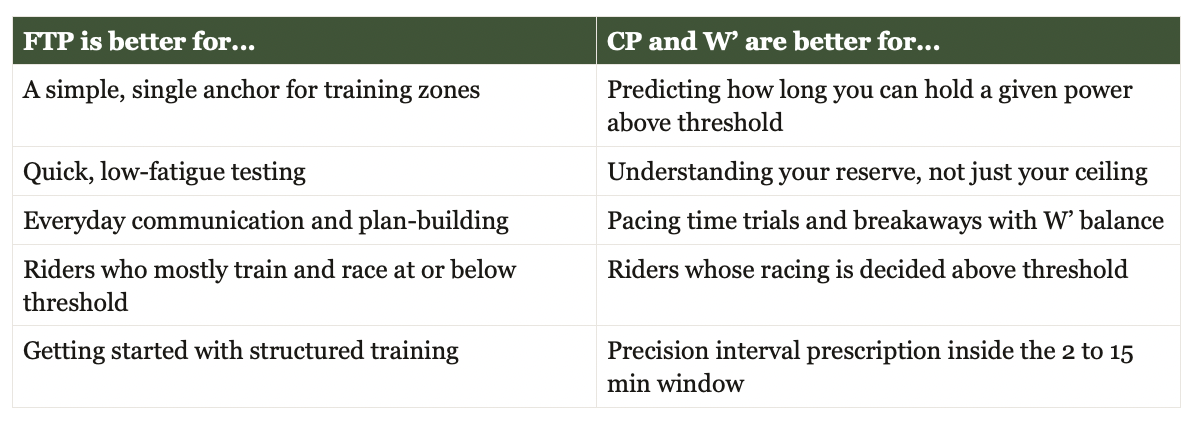
For most athletes I coach, FTP anchors the everyday training zones and CP with W’ informs the sharp end, the interval design, the TT pacing, the race tactics. The two aren't rivals. FTP tells you where the wall is. CP and W’ tell you how hard you can throw yourself at it and how many times.
Underneath all of it sits the same principle Dr. Stephen Seiler's research keeps pointing to: the more your training targets your individual physiology rather than generic percentages, the better it works. CP and W’ are individualisation you can act on, provided you keep feeding them honest data.
-
FTP is a single number estimating the highest power you can hold for about an hour, usually derived from one test. Critical Power comes from fitting a curve through several maximal efforts of different durations, and it produces two numbers: CP, the sustainable aerobic boundary, and W’, the finite work capacity above it. FTP gives you a zone anchor. CP and W’ give you a predictive model of what you can do above threshold.
-
Usually yes, slightly. Research on trained cyclists found roughly a 92% probability that CP is higher than FTP, with an average difference of about 7 watts, and other studies have reported larger gaps. The two correlate very strongly but the individual spread is wide enough that they should not be used interchangeably when setting training intensities.
-
W’ is the fixed amount of work you can perform above Critical Power before exhaustion, measured in kilojoules. Think of it as a battery above your threshold that drains when you ride above CP and recharges when you drop below it. Female cyclists typically show around 10 to 14 kJ, males around 15 to 25 kJ, and professional riders can exceed 30 kJ.
-
Use the relationship: time to exhaustion equals W’ divided by (power minus CP). With CP 300W and W’ 20 kJ, riding at 400W puts you 100W above CP, so 20,000 joules divided by 100 gives 200 seconds, or three minutes twenty. Rearranged, target power equals W’ divided by your target time, plus CP, which lets you design an interval that depletes a known amount of the reserve.
-
The two-parameter model is only reliable across roughly three to fifteen minutes. Below two minutes, neuromuscular and anaerobic factors dominate. Beyond fifteen to twenty minutes, fuelling, heat and general aerobic fatigue affect performance in ways the model doesn't account for, and there's evidence CP and W’ themselves can decline during prolonged efforts. The model will happily predict multi-hour durations just above CP. Don't believe it.
-
Most likely your data got older, not your legs slower. WKO5's headline metrics run on a rolling 90-day window, so when a peak effort ages out of that window your next-best effort at that duration becomes the new best and the curve sags. Long stretches without maximal efforts cause metrics to drift down even when fitness is stable. Doing a proper testing effort usually restores them.
-
Yes. The model can only fit a curve to efforts you've actually produced. If you haven't gone maximal at short durations, your W’ and FRC are unreliable; if you haven't done a hard sustained effort recently, your CP and mFTP are stale. TrainingPeaks' own guidance is that if your reserve balance goes below zero during a workout, the model is under-populated and you should add short maximal efforts and run a testing protocol. Racing feeds the model well because races naturally produce maximal efforts across many durations.
-
Most well-coached athletes use both. FTP is a clean, simple anchor for everyday zone structure and is easier to test. CP with W’ is more powerful for prescribing intervals precisely, pacing time trials and modelling races, because it accounts for both your sustainable ceiling and your reserve above it. Neither replaces the other.
Want your CP and W’ turned into an actual training plan?
I model every athlete's power-duration profile, keep it fed with the right testing, and build their intervals and race pacing around it, not around generic percentages. If you want training prescribed to your real physiology by a former World Tour pro, book a free 30-minute call.